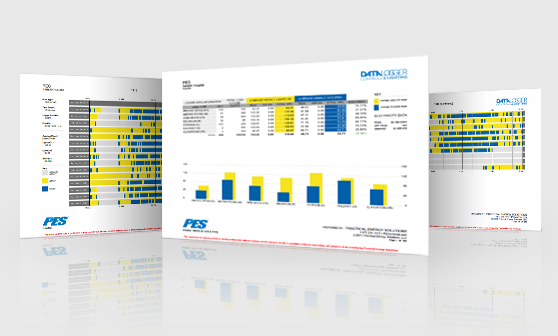
Data Logger Reports:
Enhanced Measurement & Verification Reports…
The data logging capabilities of PES are the cornerstone of the value added services we provide. The new data logger report is designed to be simple and easy to understand, even for those outside of our industry.
Through the use of state-of-the art data logging technology, PES quantifies potential energy savings from occupancy based lighting controls. It also establishes, with great reliability, the current operating hours of the facility. In short, our data logger reports provide real information about specific buildings that enables informed decision making.
Our analysis is based on monitoring statistically significant amount of the connected lighting load in each area type in a facility (e.g. restrooms, classrooms, hallways, private offices, et cetera). The report provides timelines for each specific room that was logged and then summarizes the results for each area type and for the entire building.
Our audit team installs the monitoring system in the facility. The system is comprised of independent, battery powered data loggers that are non-invasive and barely noticeable. Logger placement is completely random, although lighting loads are considered to insure a large enough sample size. After a minimum of two weeks of monitoring, our professionals collect the loggers, analyze the data, and produce the comprehensive savings report that includes real time hours of operation, peak billing hours and a summary of the savings.
The Time Line Report

A Time Line Report is generated from each data logger that is installed in a facility. The logger and the report are identified with a location or room name. The time line report captures actual hours of use and the occupancy patterns, not just how often the space is occupied, but what time of day as well.
The report contains one line for each day that the logger was installed. The bottom of the report shows the actual 24 hour timeline from left to right.
The colors on each line represent the following:
 The space was unoccupied and the lights were off
 The lights in the space were on
 The space was occupied
"Stripes" in the blue and yellow differentiate Off Peak hours of operation as opposed to solid blue and yellow which are Peak hours of operation.
Potential Energy Savings… Yellow
The times of day that contain only yellow are where the "gold" lies in energy savings potential. These are the hours in the day where the lights are on and no one is present.

Area Type Averages Report…
Each room that is monitored is assigned an area type. Rooms of the same area type are averaged together to simulate actual usages of that specific type of room. Next, the lighting loads are considered to establish a weekly usage of the entire facility.
By area type this report provides the following:

- Total Number of Loggers Installed
- Total Number of Watts Logged
- Average Weekly Hours Lights On
- Peak
- Off Peak
- Total
- Average Weekly Hours Occupied
- Peak
- Off Peak
- Total
- Percentage of Potential Energy Savings
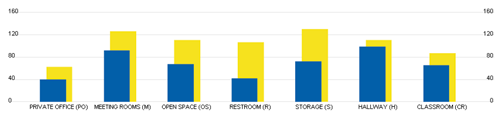
The bar graph at the bottom of this report provides a snapshot of which area types make up what percentage of the total lighting load in the facility and the yellow bars show where the "gold" lies in potential energy savings.
The upper right hand corner of the report shows the electrical rates that were used in calculating the savings.